OFPE Overview
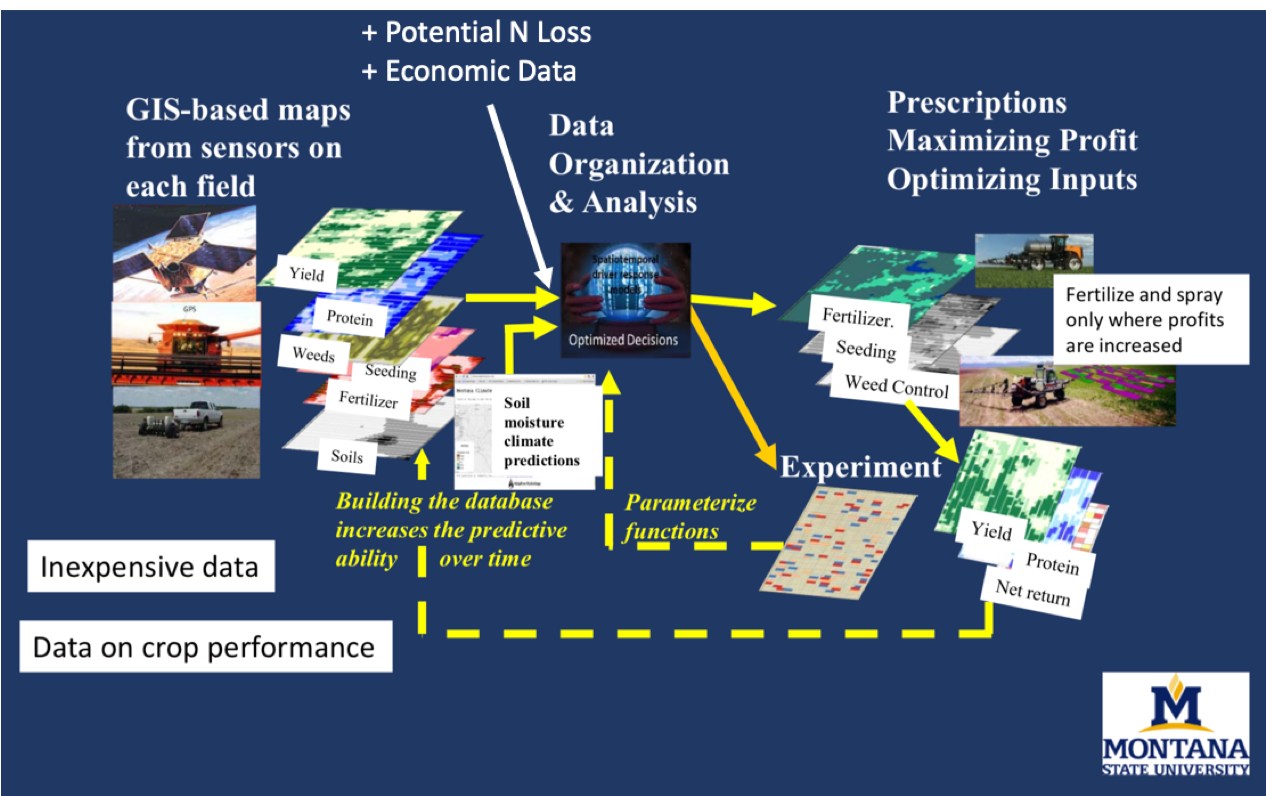
The process follows the OFPE framework below where on-farm and open source data are combined to generate a low cost decsion aid for dryland winter wheat producers. Inputs are experimentally varied across the field, covariate data from open sources is gathered, and harvest data is collected to generate an experiment for next year that tests optimized input rates. The virtuous cycle of experimentation and data collection makes predictions stronger year after year. The framework concept is currently under development in winter wheat dryland systems in Montana. See Lawrence et al. 2015 for an anaysis of the time it takes for OFPE to pay off and the OFPE Project Website for more information.

Figure 1. OFPE data framework showing the circular process of experiment creation and application, data collection, and prescription and experiment generation. Figured by Bruce Maxwell (2015).
OFPE Data Schema
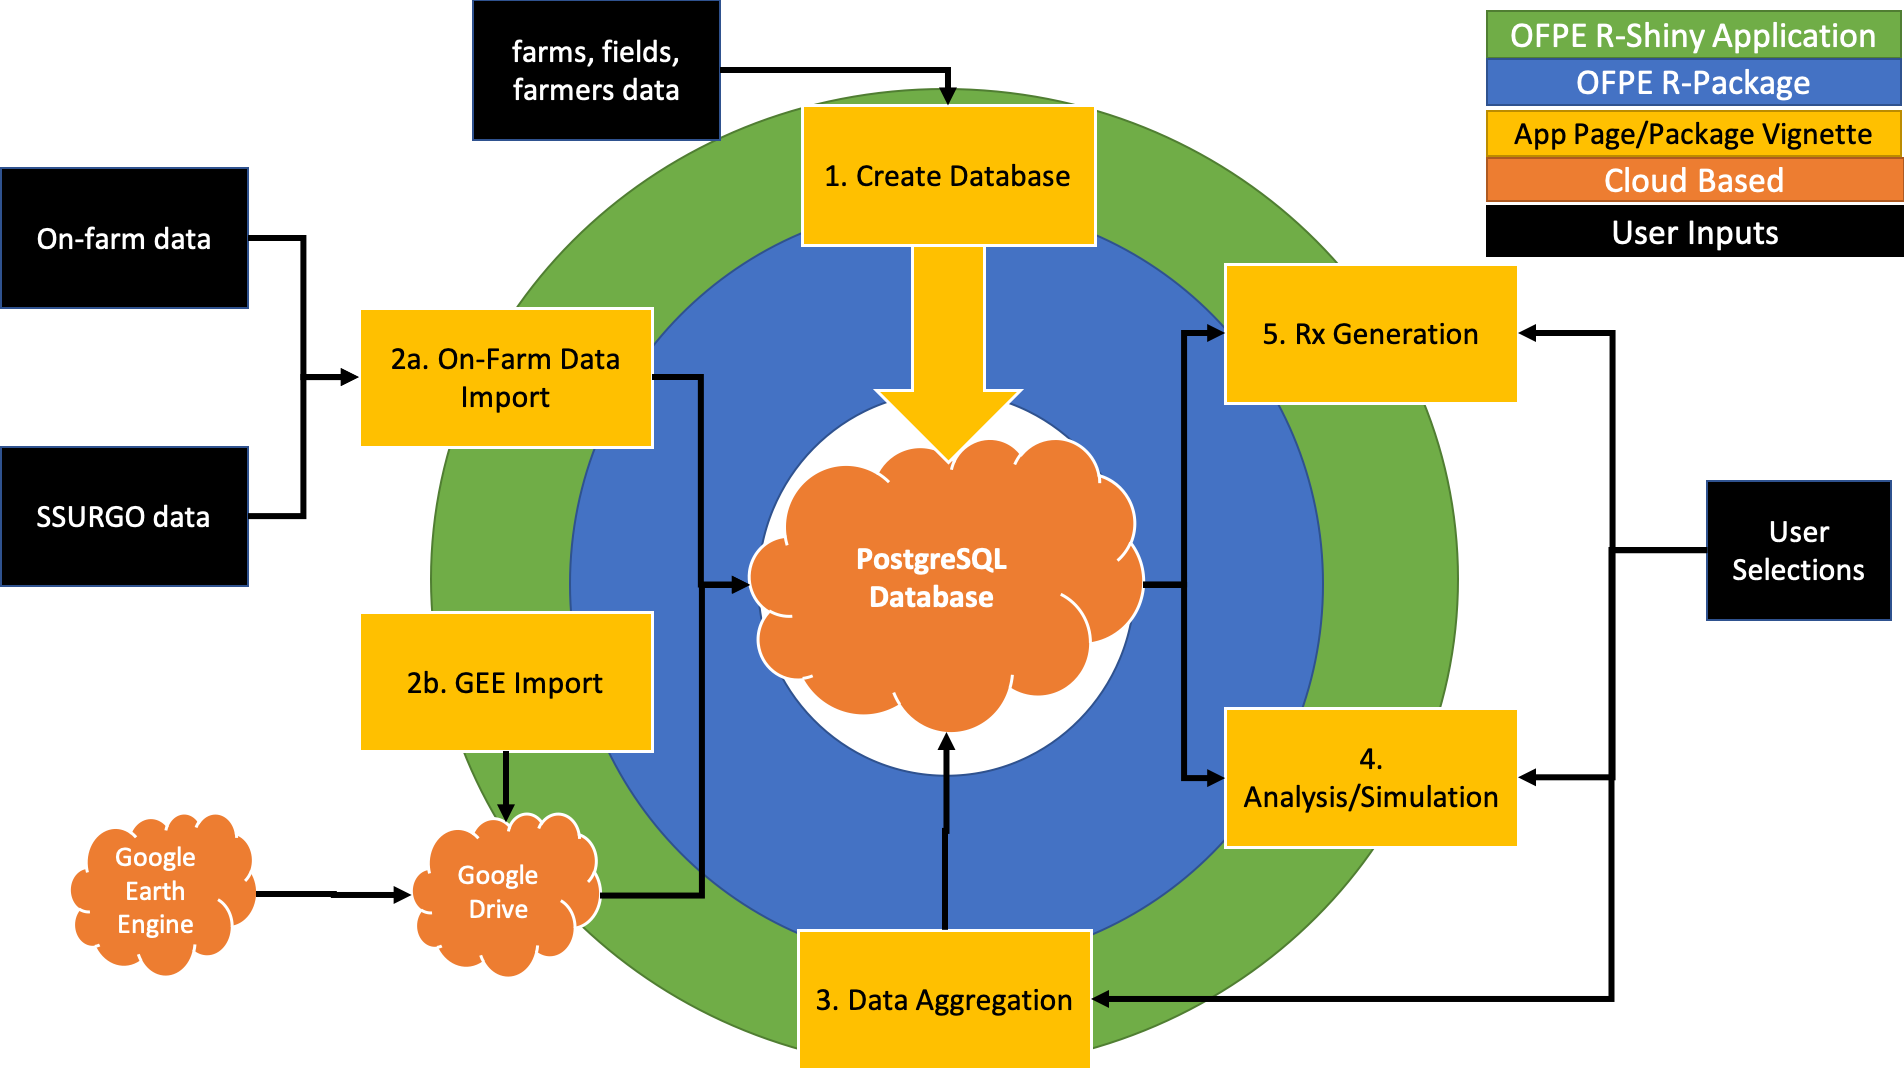
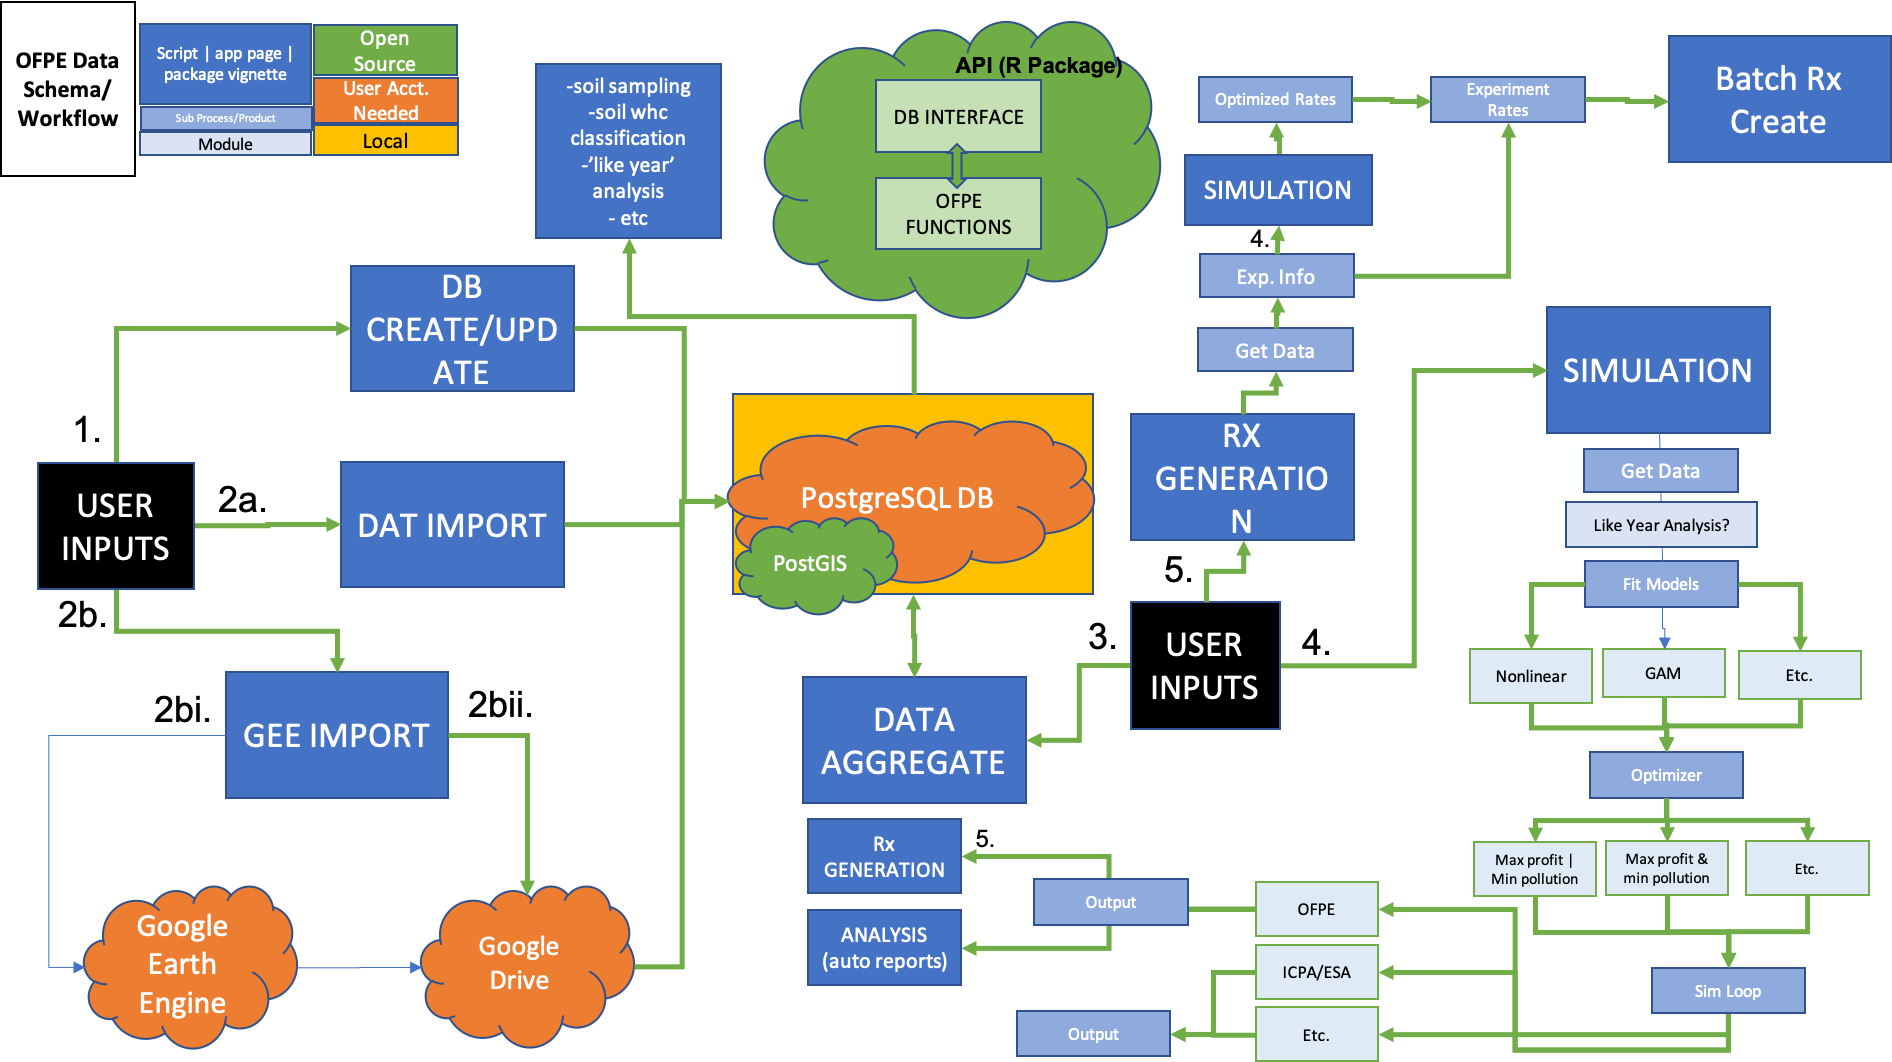
The vignettes of the OFPE package and pages of the OFPE web application both follow the OFPE framework workflow. The vignettes are the low level API equivalent to pages found in the high level API found in the OFPE web application. Both of these tools are centered around and dependent on an OFPE formatted database (Figure 2, 3). The OFPE R package provides the codebase that interacts with the database in response to user actions. The OFPE web application uses the OFPE R package to provide an easy to use GUI interface to the users. This is represented in Figure 2 by the concentric rings surrounding the database, with the blue OFPE package ring closest to the database and the green OFPE web app ring closest to the users. The rings touch because the OFPE package powers the OFPE web app. The yellow boxes in Figure 2 represent each process in the OFPE data workflow, and are different pages available for the user on the OFPE web app, which also have an accompying vignette in the OFPE R package to demonstrate the usage of the code outside of the OFPE web app GUI. This process consists of setting up (creating) the database with user specified field and farm data (Step 1), importing data collected on-fields and from open sources like SSURGO and Google Earth Engine (Step 2a & 2b), enriching yield and protein datasets by aggregating covariate data (Step 3), analyzing response of yield and protein to variable input rates, simualting and predicting net-return outcomes of management strategies (Step 4), and generating site-specific prescriptions of inputs (Step 5). Figure 2 represents a simplified schematic visualizing the relationship between the database, R-package, R-Shiny application, and the user while Figure 3 illustrates the process in more detail.

Figure 2. Key is found in the top right corner of the schematic. The green ring represents the R-Shiny OFPE web spplication which is driven by the OFPE R-Package (blue ring). These both require connection to a PostgreSQL spatial database with PostGIS enabled. The yellow boxes represent different pages of the OFPE web application and vignettes in the R-package. Black boxes represent user inputs and orange clouds represent cloud based tools.
Below are schematics of the general OFPE data workflow and a more detailed diagram.

Figure 3. Key is found in the top left corner of the schematic. Green arrows represent processes that require the OFPE package. The PostgreSQL database in the center of the figure can be stored on a cloud server or a local computer (as indicated by shape). Dark blue boxes indicate processes that are vignettes of the OFPE package or pages of the OFPE Web Application. Light blue boxes represent alternate modules for executable processes.